MaxBoard. Viewing, managing and collaborating on project data has never been easier.

Book a Free Demo

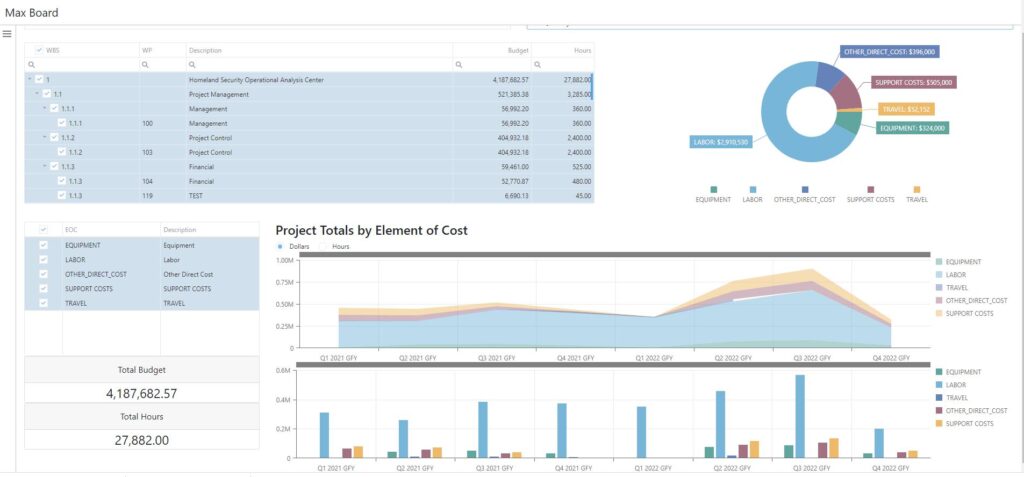
MaxBoard is ProjStream’s interactive visual dashboard. It pulls data from both BOEMax and MaxTeam and organizes it in charts, graphs and neat data views. Build your own dashboards using API calls from a pre-existing data platform. This way, you can easily track financial and project performance, address emerging issues and make informed decisions.

How It Works

Measure Key Metrics

Step 1

Configure KPIs and produce metrics to track performance for a specific project, a group of projects or enterprise-wide.

  • Schedule and cost variances
  • Variance at completion
  • To-complete performance index
  • Resource capacity and demand
  • Profit margins
  • Project funding
  • Revenue forecasting
  • Overall project health indicators

Manage Projects from Proposal to Completion

Step 2

With reliable and easy-to-view source data, you can manage costs and resources throughout the project life cycle and have visibility into the current work progress and financial status at all times. Better yet, the data quality improves over time as you input more data, enabling you to produce ever-more accurate estimates, budget plans and more.

Visualize Dynamic Data

Step 3

Forget static reports and presentations. With MaxBoard, you can leverage a combined interactive view of pipeline and active projects to quickly assess live performance metrics, resource capacity and demand, specific contracts or work elements and much more.

Win more contracts, deliver on projects faster and increase your revenue.

Book a Demo Now